Platform
Everything you need to read the chain.
Four tools that share one data layer. Use them in the web app, in your chat tools or through the API.
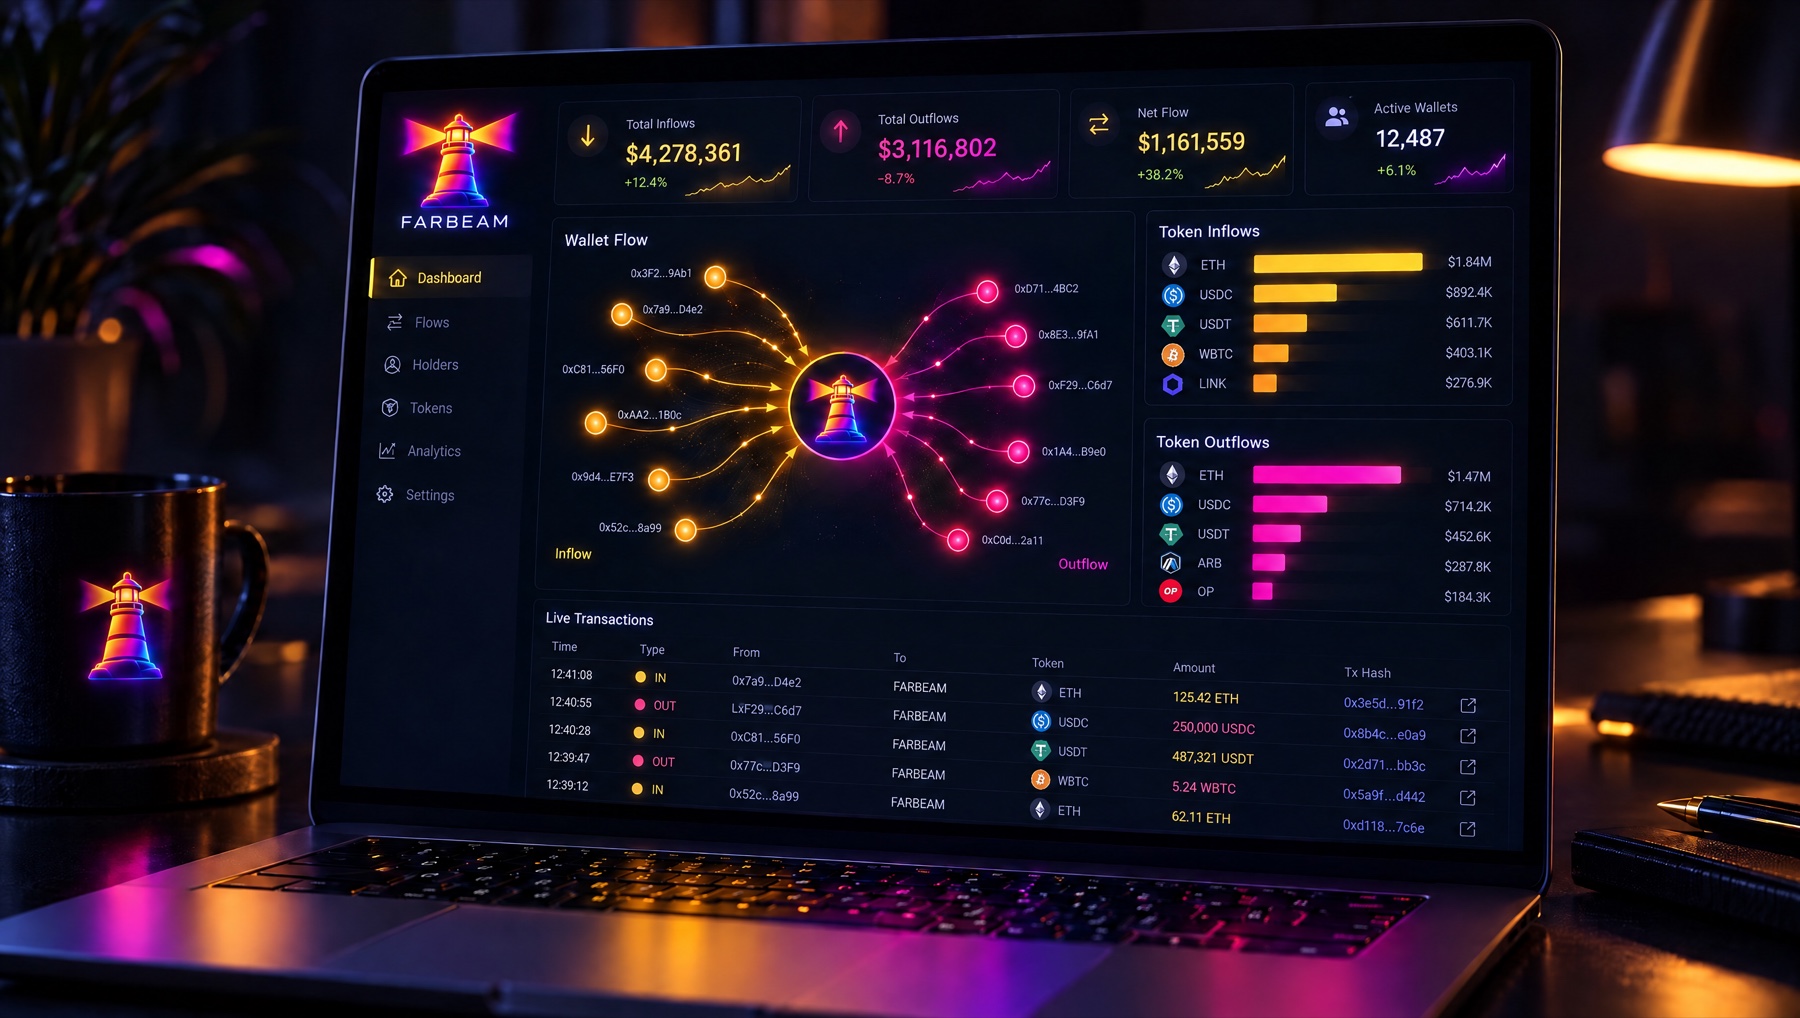
Example dashboard · illustration
01 · Wallet tracking
Watch the wallets that matter
- Track single wallets or whole label groups
- Net flows per token, per day, per chain
- Wallet-flow graph: sources and destinations
- Notes and tags shared with your team
02 · Token reports
A token, explained in one page
- Holder count and top-10 share over time
- Liquidity depth and LP changes
- Deployer and dev-wallet activity
- Clear risk flags with the data behind them
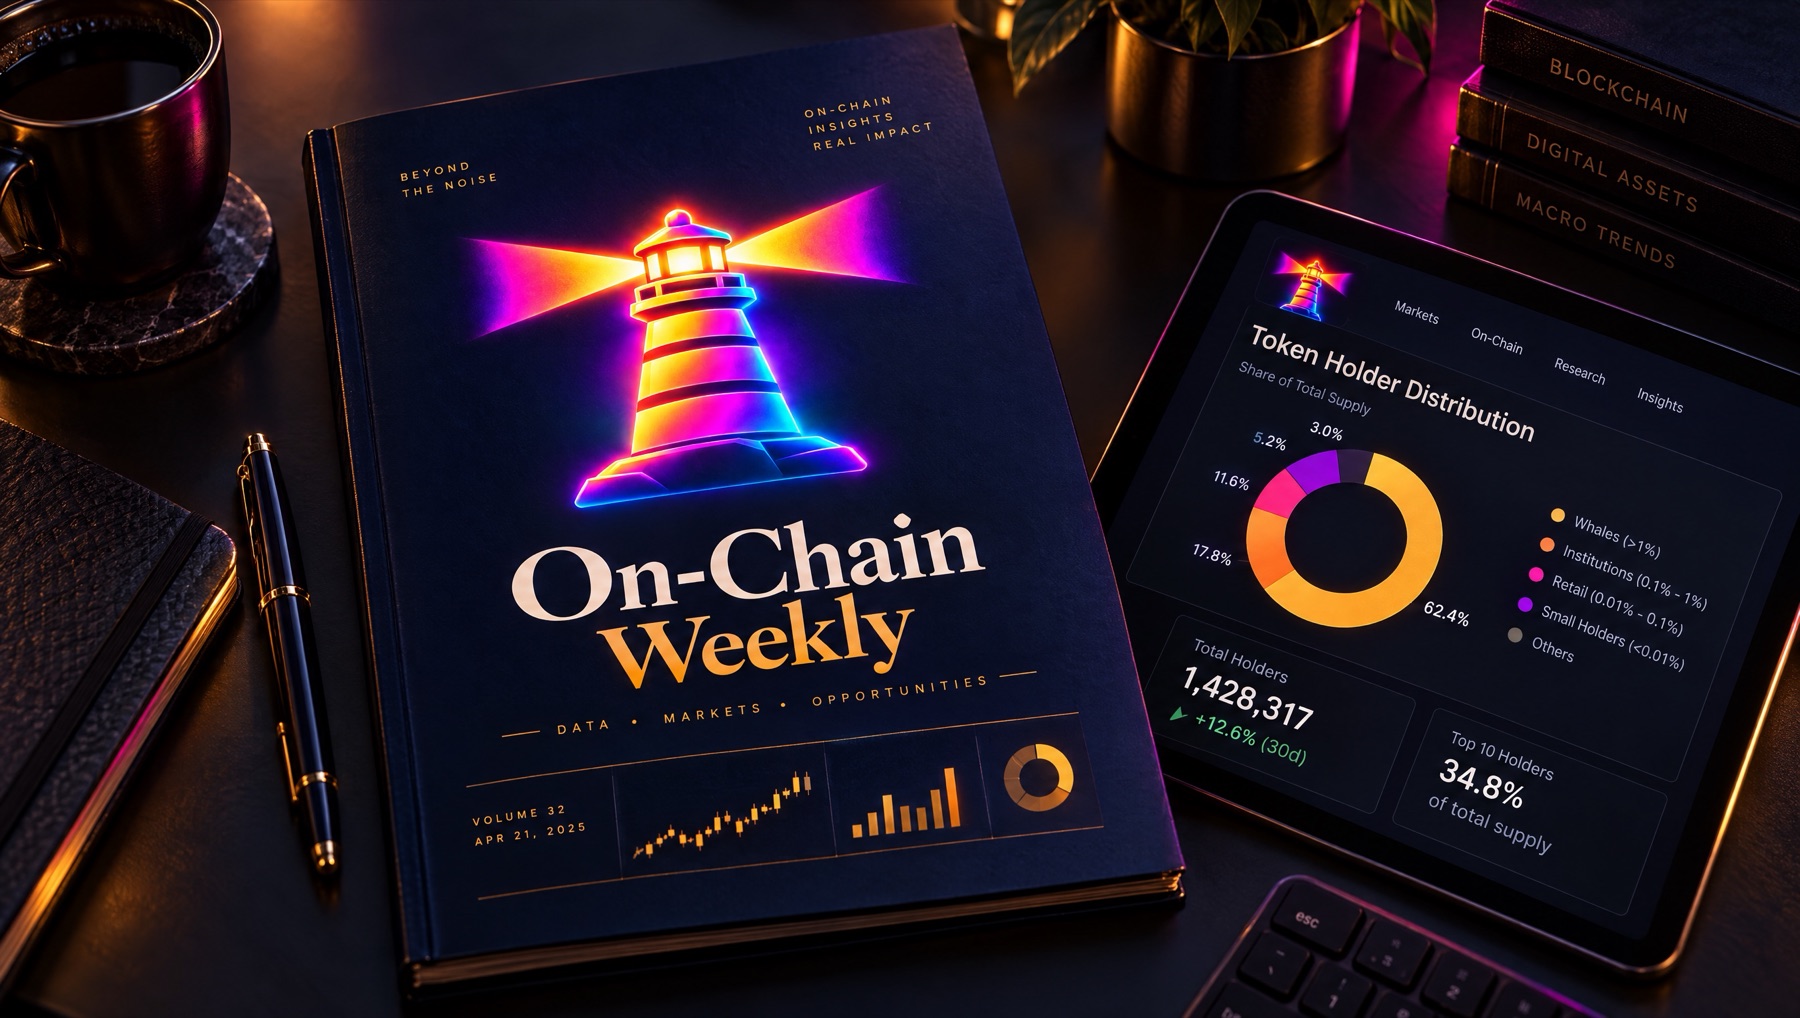
Report design · illustration

Example alerts · illustration
03 · Real-time alerts
Know in seconds, not hours
- Rules on wallets, tokens, pools and bridges
- Thresholds by amount, share of supply or USD value
- Delivery to Telegram, Discord, email and webhooks
- Quiet hours and de-duplication
04 · Data API
Build on clean, labeled data
REST endpoints for wallets, tokens, pools and labels. Webhooks for every alert rule. Clear rate limits and a free tier to test.
# Net flows for a wallet, last 24 h
curl https://api.farbeamlabs.com/v1/wallets/7xKX…9fQa/flows?window=24h \
  -H "Authorization: Bearer $LL_KEY"
Early access
See the chain before the crowd does.
We onboard teams in small batches. Tell us your chains and what you track. We reply within one business day.